Most IT departments already monitor their email systems closely. They track server load, storage consumption (the leading cause of email outages), response times, synchronization issues, and activity peaks throughout the day. This view remains primarily technical and serves a very practical purpose: maintaining a stable, available service capable of supporting everyday usage.
Yet an email platform reveals far more than the health of an infrastructure.
Every Outlook connection, every mobile synchronization, every shared mailbox, every delegation granted between colleagues, and every automatic rule created within a mailbox leaves behind valuable information about how teams actually work. These data points reveal collaboration habits, dependencies that have become invisible over time, and informal organizational structures that may never have been documented but on which daily operations nonetheless depend.
Most organizations already possess this information. It exists in activity logs, monitoring metrics, authentication records, and audit tools. The challenge is not generating more data. The real difficulty lies in transforming technical information into a concrete understanding of business practices.
This is precisely what BlueMind’s analytics and monitoring tools are designed to do.
Email: a window into how your organization operates
When an IT department starts analyzing email usage in greater detail, it often discovers a reality that is far more complex than official procedures or governance tools suggest.
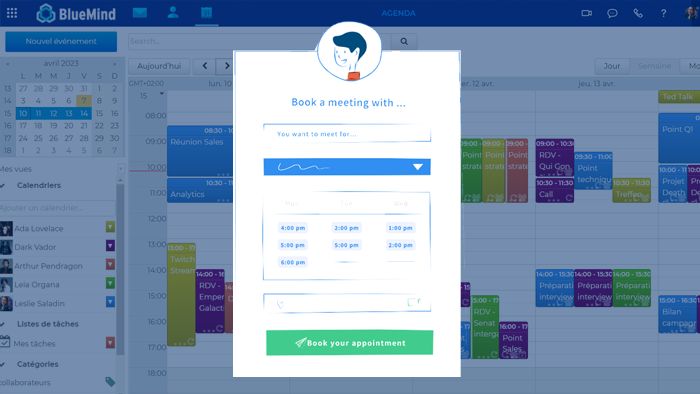
Some teams structure their entire workflow around Outlook delegations. Others rely primarily on shared mailboxes, which have evolved into genuine collaborative workspaces. In other cases, the shared calendars associated with these mailboxes organize the daily activity of an entire department. Nobody considers these practices unusual because they have become deeply embedded in everyday work habits.
BlueMind makes these practices visible. Activity logs can track connections, calendar sharing, delegations, automatic rules, and message movements between folders.
This fundamentally changes the way email is viewed. Instead of looking solely at a technical platform that transports emails, organizations gain visibility into how people actually collaborate every day.
Connection data also provides valuable insight into user habits. It shows whether teams primarily work in Outlook through MAPI, in the webmail interface, on mobile devices, or through IMAP clients such as Thunderbird.
This information becomes extremely valuable whenever an organization wants to evolve its collaboration environment. Unlike a brand-new collaborative platform that imposes new ways of working, email does not have that luxury. It must evolve smoothly without disrupting established habits, familiar features, or preferred access methods.
Users rarely have time to learn a new tool when their current way of working already meets their needs. IT teams do not have the capacity to manage a cultural and operational transformation affecting every employee. Organizations cannot afford productivity losses caused by changing their email platform.
Migration projects: understanding usage reduces friction
In many migration projects, transferring emails, contacts, and calendars is ultimately a relatively straightforward task. The real challenges emerge when organizations discover how deeply certain collaborative practices are woven into daily operations.
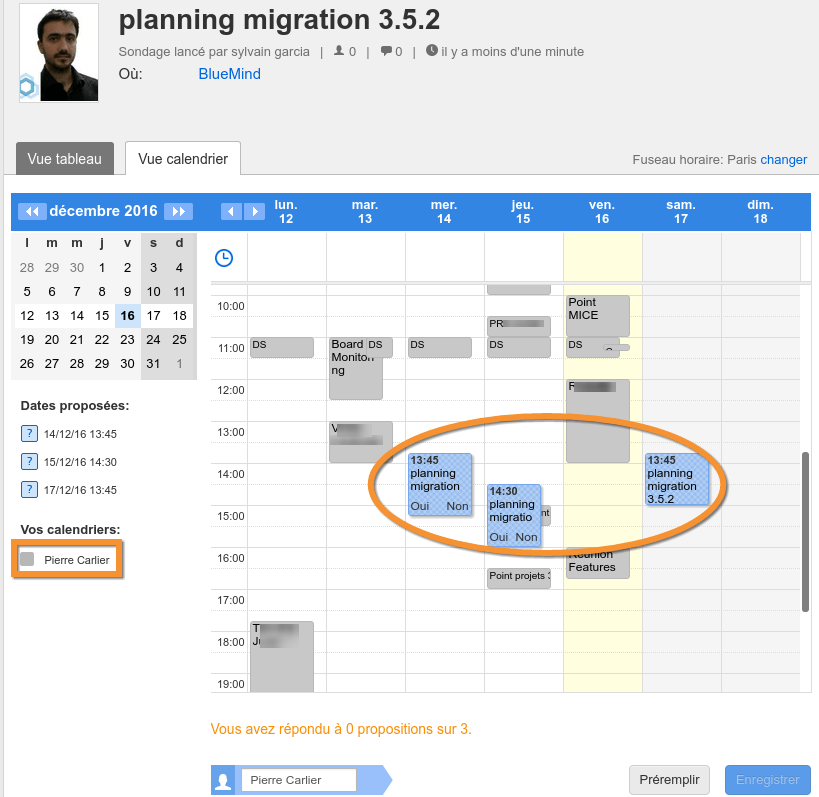
A detailed analysis of email usage often reveals—sometimes very late in the project—that entire departments depend on Outlook delegations, shared mailboxes, or advanced calendar features used by executives and assistants.
Email data helps anticipate these situations much earlier. It allows organizations to identify which practices must be preserved, which user groups will require additional support, and which migration scenarios truly reflect operational realities.
This is often where a critical question emerges: which access methods should be offered to which users?
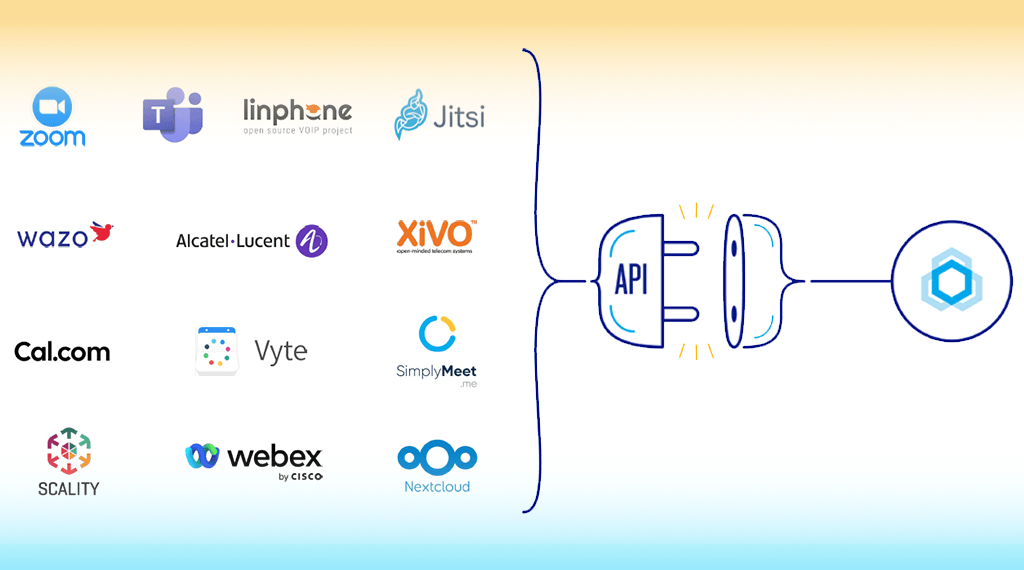
At BlueMind, native Outlook support removes one of the main barriers to migration by allowing organizations to preserve Outlook where it remains essential. From there, usage can evolve according to actual needs, whether through Outlook, webmail, mobile devices, or Thunderbird enhanced with BlueMind collaborative features.
The objective is not to create isolated user groups with different levels of collaboration depending on their email client. On the contrary, advanced collaborative features remain consistent across access methods so that users can continue working together seamlessly through shared calendars, shared resources, and everyday collaborative workflows. This flexibility also allows organizations to gradually evolve the choices made at the beginning of a project without having to rebuild their collaborative environment at each stage.
Using analytics to better support users
Email statistics become particularly valuable when they support user adoption and change management in addition to monitoring servers.
Within the same organization, users rarely work in the same way. Some rely heavily on automatic rules, shared calendars, and delegations. Others make extensive use of message importance flags, follow-up indicators, categories, and color coding.
A successful migration takes these different habits into account. Usage data helps organizations understand how teams actually work, making it possible to adapt communication, migration strategies, and user support accordingly.
A support team working primarily through shared mailboxes has different needs from an occasional webmail user. Executives accustomed to advanced Outlook functionality depend on a different feature set than a workforce that mainly accesses email from mobile devices.
To support these diverse needs, BlueMind provides customers with a complete adoption ecosystem called AllBlueMind.
Documentation, user guides, short videos, webinars, forums, and a knowledge base are all accessible through a single entry point, making it easier for users to progressively adopt the solution.
Cette approche permet d’accompagner des populations très différentes (administrateurs, support, utilisateurs) sans imposer un parcours unique.
This approach supports very different audiences—including administrators, support teams, and end users—without imposing a one-size-fits-all adoption path. An experienced Outlook user, a team working mainly in webmail, and technical administrators will not require the same information or adopt new tools at the same pace. AllBlueMind provides the resources needed to build tailored onboarding and change management plans.
Metrics also reveal how work practices evolve
The data generated by an email platform also makes it possible to observe how communication flows evolve over time.
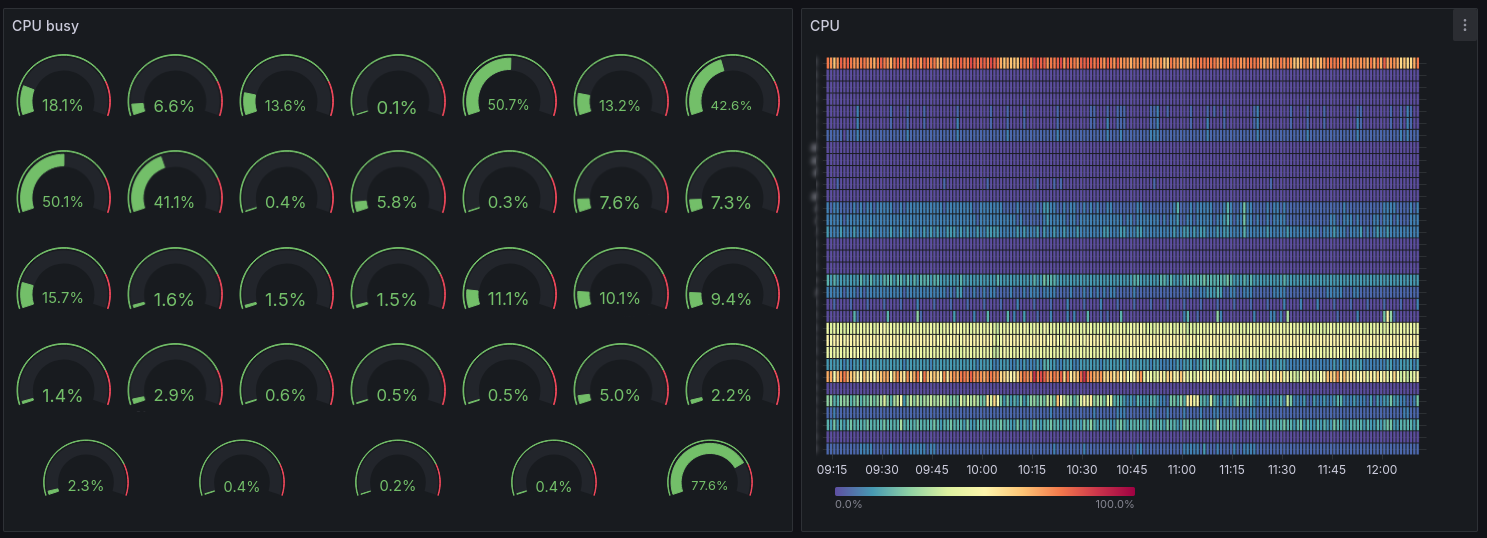
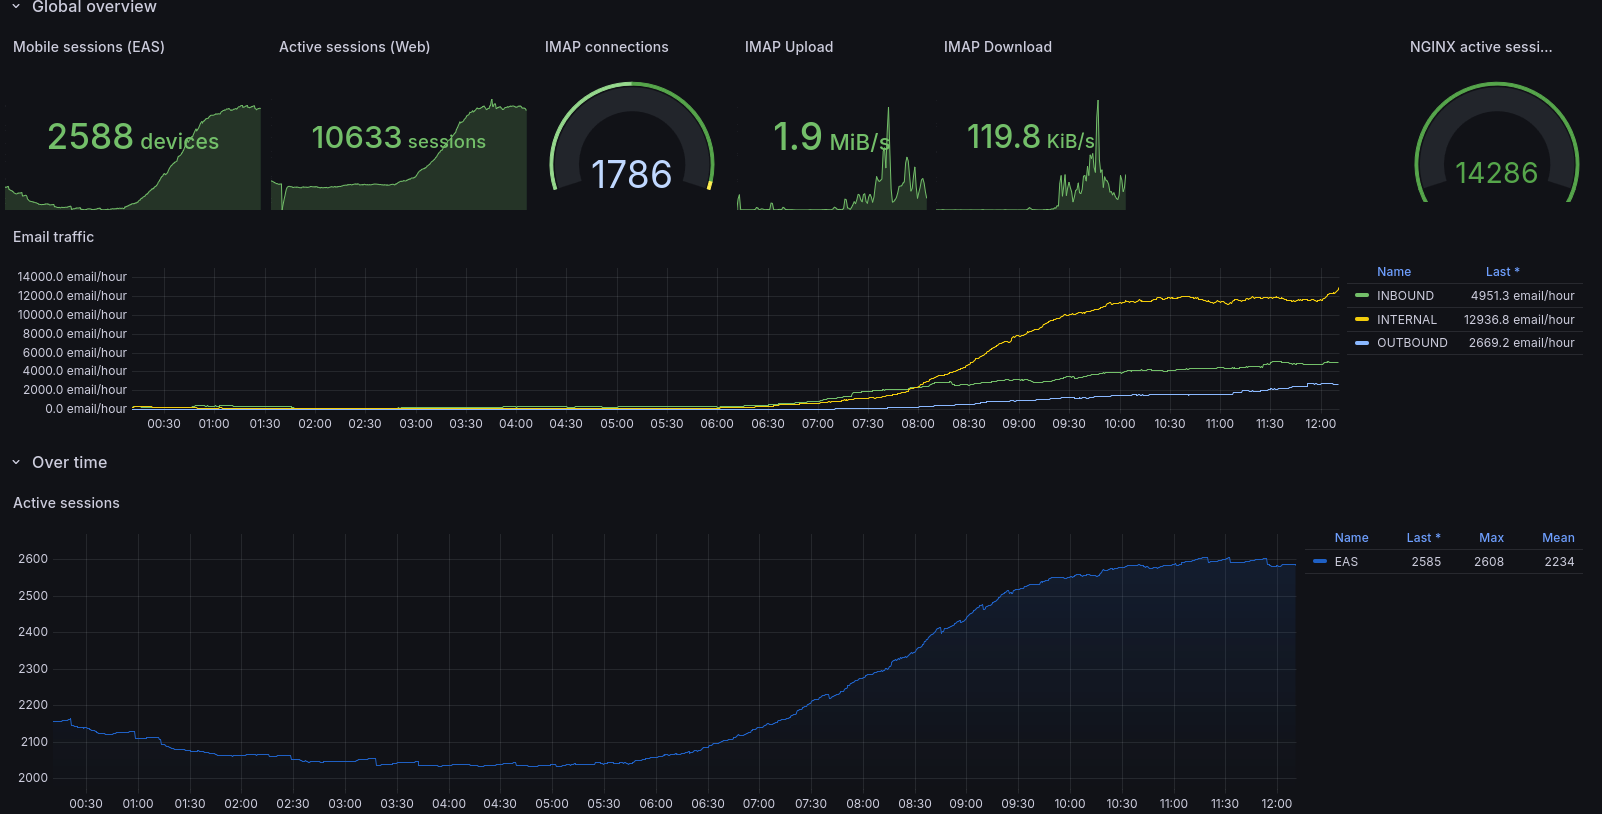
BlueMind stores historical metrics related to activity volumes, message sizes, connections, recipients, and the behavior of the various platform components.
Want to understand working hours within your organization? Email connection data often provides the clearest picture, revealing arrival times, breaks, departures, and overall usage patterns with remarkable accuracy.
Certaines évolutions deviennent très parlantes lorsqu’on les observe dans la durée. Par exemple, une entreprise modifie sa signature de mail avec des visuels beaucoup trop lourds. Les utilisateurs continuent à travailler normalement sans percevoir de différence particulière, mais quelques jours plus tard les volumes explosent, les synchronisations ralentissent et la charge des serveurs augmente fortement. Les métriques permettent d’identifier immédiatement ce type d’évolution.
Some changes become particularly meaningful when viewed over time. For example, an organization may update its email signature with graphics that are significantly heavier than before. Users continue working normally without noticing any difference, but a few days later storage consumption increases dramatically, synchronizations slow down, and server load rises sharply. Metrics make these trends immediately visible.
A sudden increase in average email size may indicate that a new practice is spreading throughout the organization, while an unusual rise in authentication failures could signal an attempted cyberattack. Behind every variation lies a concrete operational reality. The real value of these metrics comes from observing them over time and placing them in context. BlueMind’s integrated monitoring tool, bm-tick, preserves historical metrics, enables the creation of dashboards tailored to IT requirements, and helps organizations observe the gradual evolution of collaborative practices.
Conclusion
At BlueMind, understanding usage patterns is a fundamental part of the way email is approached.
Monitoring tools, metrics, activity logs, and connection data are not only used to supervise servers. They help organizations understand how users actually work, making it possible to build smoother migration projects, preserve critical collaborative practices, and gradually evolve access methods without disrupting the organization.
This philosophy also explains BlueMind’s approach to native Outlook support, webmail, mobile access, and collaborative Thunderbird. The goal is to align as closely as possible with existing user habits while giving organizations the freedom to evolve at their own pace and maintain a consistent collaborative experience for everyone.
Ultimately, email statistics become far more than a technical tool. They provide IT departments with a concrete view of how their organization operates and give BlueMind the means to support realistic, progressive transformation projects aligned with everyday business practices.